
Are your monthly reports a source of dread? Do you spend days manually updating spreadsheets, only for them to be out of date the moment they’re shared? If you’re a Brisbane business grappling with this reality, you’re not alone. Many local companies face this exact challenge. The inefficiency doesn’t just waste time. It also means you’re making decisions based on old, potentially incorrect, data. This often leads to a crucial question: when should you consider Power BI vs Excel in Brisbane for your reporting needs?
The Familiar Friend: Excel's Enduring Role
For decades, Excel has been the undisputed champion for data analysis. It’s powerful for quick calculations and managing smaller datasets. Nearly every business in Brisbane has teams comfortable working with it. You probably use it daily for budgets, contact lists, and ad-hoc number crunching. It's truly versatile for individual, contained tasks.
But when it comes to complex, ongoing business reporting, Excel quickly hits its limits. Imagine trying to consolidate sales data from multiple systems for a dozen retail stores across SEQ. You're copying and pasting, linking sheets, and dealing with broken formulas. Suddenly, simple insights become a massive undertaking. Version control is another huge headache. Has anyone ever worked on the wrong file, or wasted hours combining different versions? That’s a common scenario for many Brisbane businesses. This manual effort eats up valuable staff time and introduces costly errors. Excel simply isn’t designed for large-scale, dynamic reporting.
Your team might spend days each month just preparing reports. This takes away from strategic work. The data is often outdated the moment it's presented, too. This makes proactive decision-making much harder. It's a common struggle for growing companies here in Queensland.
Power BI: Unlocking Deeper Insights
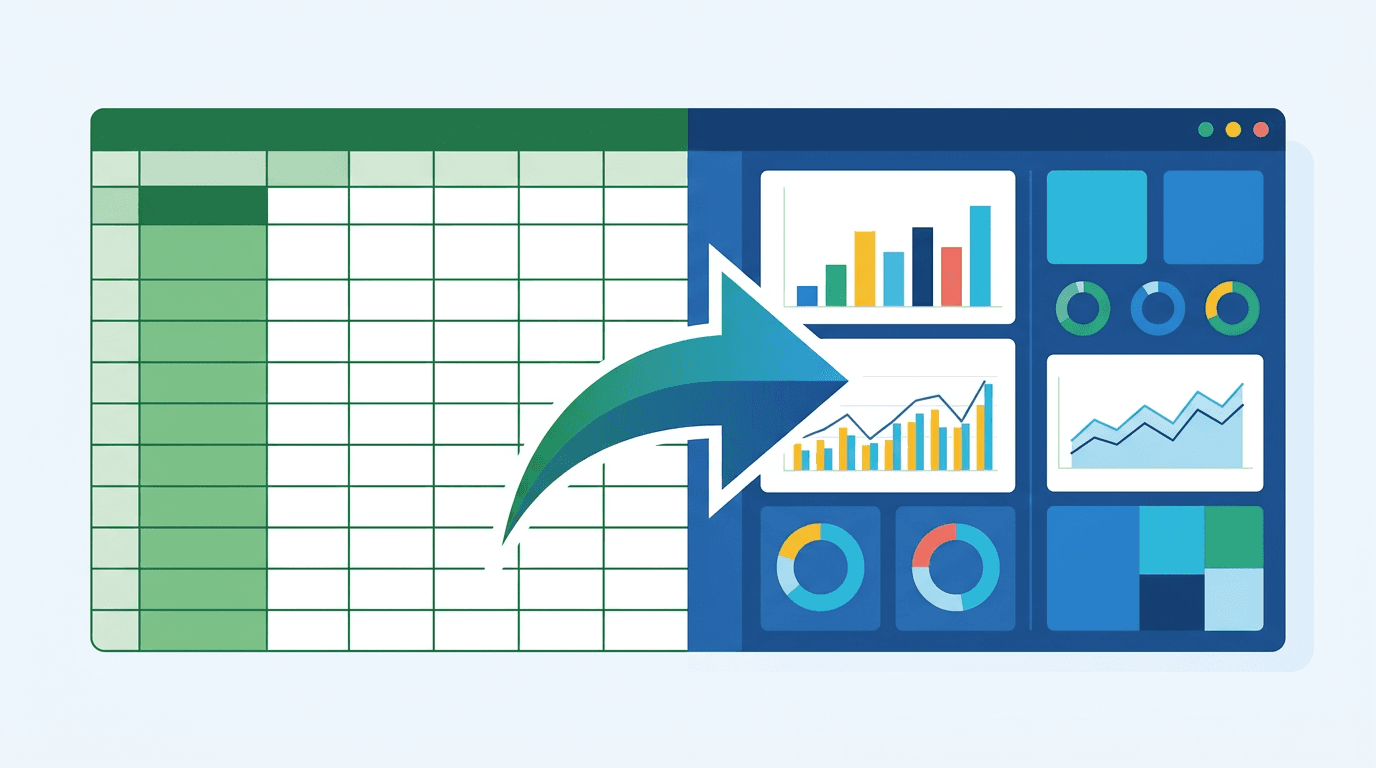
Power BI steps in exactly where Excel starts to struggle. It’s a dedicated business intelligence tool. Think of it as Excel’s big, more powerful sibling for reporting. It connects to almost any data source you can imagine. This includes your CRM, accounting software, databases, and even your existing Excel files. Then it transforms that raw data into interactive dashboards.
Your team gets real-time, visual insights. Instead of static tables, you see dynamic charts and graphs. You can click to filter data, drill down into details, and spot trends instantly. Imagine a property developer in South Brisbane tracking project progress, costs, and sales conversions all on one dashboard. They can see which developments are on track and which need attention at a glance. It changes how you make decisions, making them faster and more informed.
- Connects to many disparate data sources, centralising your information.
- Automates data refreshes, giving you current information every hour or day.
- Creates interactive, visual dashboards for easy understanding by anyone.
- Allows secure sharing of reports across your organisation, controlling access.
- Handles vast amounts of data without slowing down your system.
- Provides mobile access to reports, letting you check key metrics on the go.
Making the Switch: When and How to Decide
So, how do you decide between Power BI vs Excel in Brisbane? It’s not about abandoning Excel entirely. It's about using the right tool for the right job. If your reporting involves pulling data from more than two or three sources, or if your Excel files are slow and prone to errors, Power BI is likely your answer. If your team needs to collaborate on reports, sharing interactive dashboards is much better than emailing static PDFs.
Consider these signs that it's time for Power BI:
- You spend too much time manually updating reports.
- Your existing reports are too large or complex for Excel.
- You need to combine data from many different business systems.
- Your team struggles with inconsistent data versions across departments.
- You want interactive, real-time dashboards, not static summaries.
- You require a single source of truth for key business metrics.
For many Brisbane businesses, an effective strategy involves both. You might still use Excel for quick, individual calculations. However, for consolidated, ongoing reporting that provides a single version of truth, Power BI provides the clarity and automation you need. This hybrid approach often works best during a transition. We can help you streamline your existing processes. Our Excel reporting automation services can make your current spreadsheets more efficient. For a full leap forward, our Power BI consulting team guides you every step of the way. We ensure a smooth implementation and user adoption.
Moving beyond basic spreadsheets to a sophisticated tool like Power BI can truly transform your business. It turns raw data into actionable insights, saving significant time and reducing costly errors. This frees your team to focus on strategy and growth, not tedious data entry. Are you ready to explore how better reporting can help your Brisbane business thrive? At Roar Data, we specialise in helping local companies make smarter data decisions. We can assess your current reporting setup and recommend the best path forward for you. Let’s chat about optimising your data.